
The price of Oil hit a new, all time low yesterday (Monday, April 20th) – and that low is actually negative, meaning that oil producers will pay their customers to take oil off them (the logic being that it’s cheaper for the producers to do that than to store it themselves). Given this development, this week, we’re taking a short break from our usual managed futures/hedge fund/liquid private equity industry analysis and instead we’re taking a look at the five best performing – and 5 worst performing – daily factor indices from index provider MSR Indices (they have 1124 in total) from the beginning of the year through April 17 to see how Oil-based strategies are doing.
The dispersion between strategies is indeed incredible, and it is also interesting, albeit unsurprising, that both extremes are represented by Oil futures-based strategies with the best performing product being the MSR Crude Oil Trend Following TV 20 Algo (up almost 44%) and the worst performing product being the MSR Crude Oil Exposure Dollar Weighted Algo (down a staggering 69%). And while data for Monday, April 20, was not yet available at the time of writing, the astonishing negative price of oil of -$37.63 for West Texas Intermediate just adds to the parade of unprecedented events that keep happening this year.
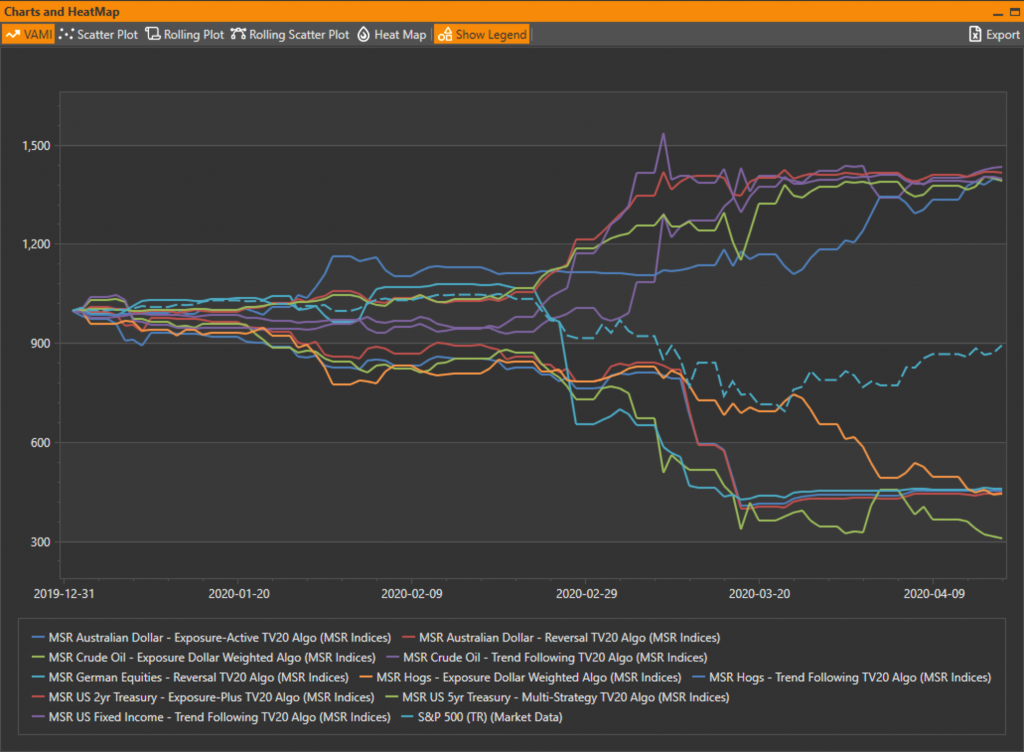
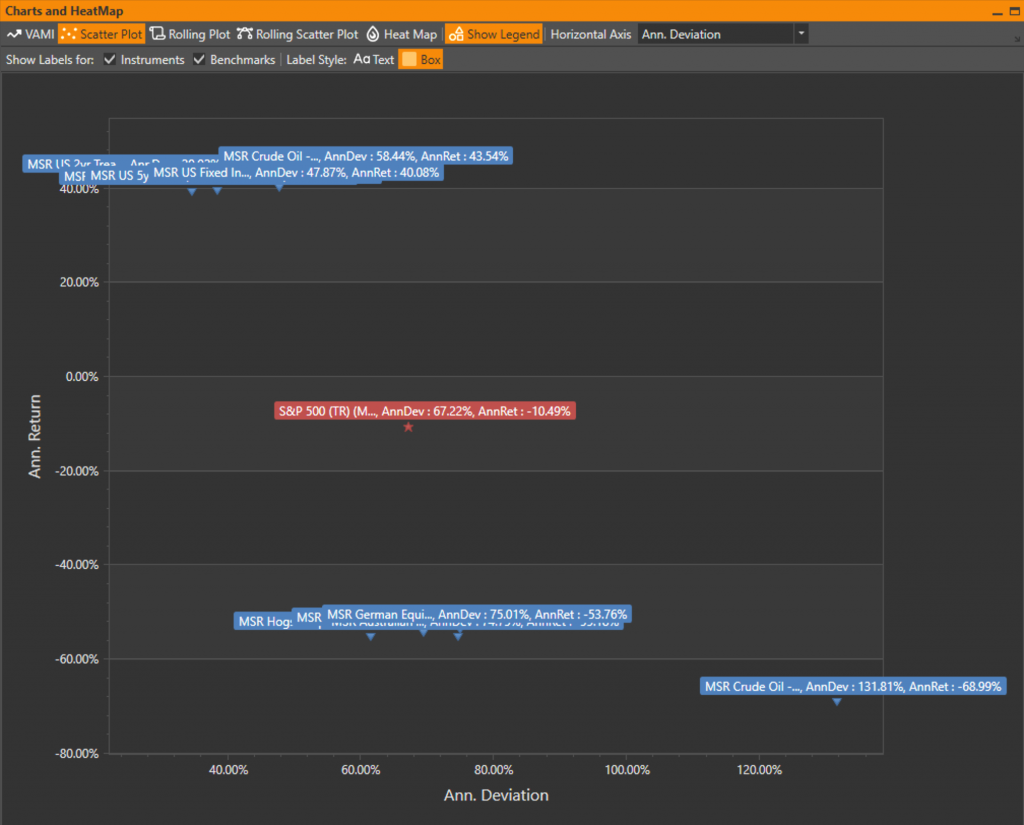
Just for reference, we included the S&P500 performance in the above chart (the dashed light blue line). Given that we’re looking at the five most extreme performers from the MSR Indices universe, it’s not surprising that the S&P500 is the most ‘tame’ of the entire set but in turn that speaks volumes about what is happening in other parts of the market as opposed to just equities. The scatter plot below highlights the extreme volatility of the Oil strategies quite well.
Regarding the overall distribution of returns, the negative sentiment also seems to dominate so far, with only one third of the programs out of the complete set of 1124 staying positive YTD. It’s been difficult for most investment managers to produce positive numbers for their clients this year, so we will be sure to check back in on this in a future post to see how this distribution plays out going forward.
In conclusion, here are the returns for the best and worst 5 we reviewed:
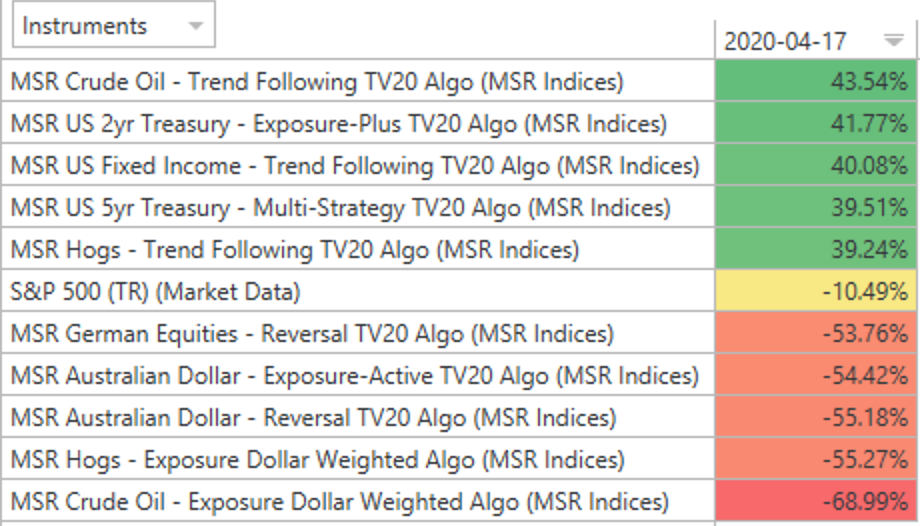
Note that 3 out of the 5 best performers are Trend Following strategies (and none out of the worst 5 are). This is a good indication that trend following still “has it”, and can deliver excellent results when many other strategies falter. Those managed futures strategies that have been short oil could not have been expecting a better result – what can be better for a short seller than prices crashing through the floor and going negative? Talk about a boost to performance…
Of course, there is more to good results than just the type of strategy. Time horizons, volatility, market specifics and many other factors go into the final performance, so we will keep monitoring the space to see how things evolve in these turbulent times.
This post is part of our Alpha-Week blog and can be found here: https://www.alpha-week.com/oil-volatility-provides-heaven-and-hell-commodity-traders
