
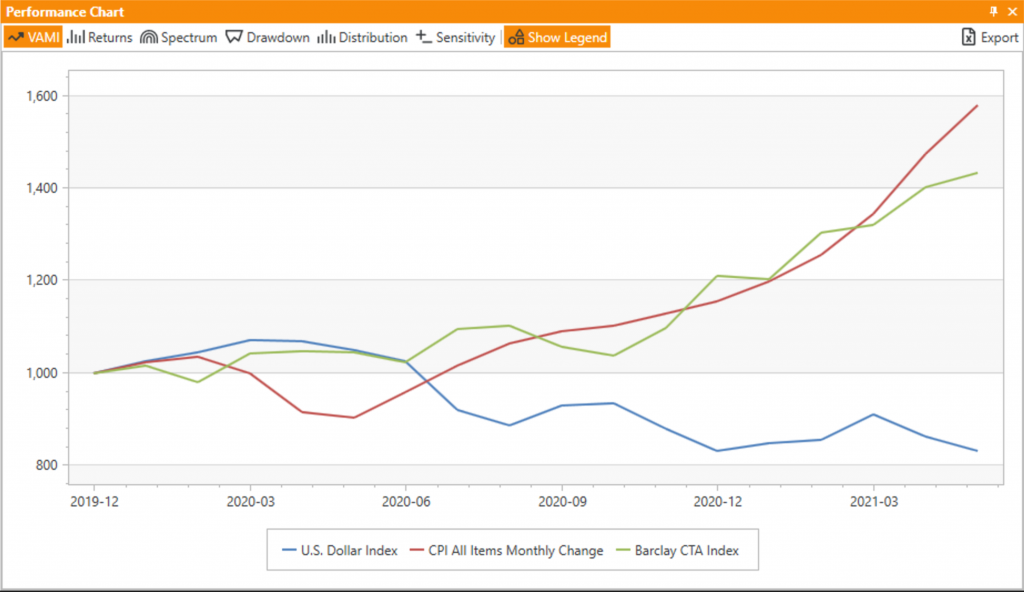
Commodities have traditionally been an inflation hedge, and with growing concerns over rising prices expressed by many, including yours truly, we wanted to take a look at how managed futures strategies are doing in the current environment. We plotted the monthly percent change in the CPI index, the Dollar Index, and used the BarclayHedge CTA Index as our proxy for managed futures performance.
Due to the lower volatility of the CPI index (it has a rather bulky methodology and data collection methods), we are normalizing the volatility of the indices to 15% annualized, and the resulting chart, while simple, begins to look very interesting. As we can see, CTAs are charging after the CPI index, supporting their inflation hedging reputation, all while the Dollar index continues its steady decline.
It must be said that the CPI does not necessarily reveal *all* inflation – its methodology has been consistently adjusted over the years, with periodic removal or replacement of items that are most sensitive to rising prices, leading to some economists calling the changes controversial. And it is difficult not to agree if you, like most people, fuel your car with gas and buy groceries. In fact, the 12-month YOY change in the CPI for Gasoline is a whopping 56%, bringing the change for the overall Energy sector to 28.5%.
In addition, the pandemic, while generally moving away, still causes significant issues globally with some countries extending their lockdowns and other preventative measures, having impact on production and supply lines. This does not seem to be much of a concern for politicians issuing more and more stimulus money – they appear to think that simply pushing the “print” button makes goods and services automatically appear on the store shelves. Such logistical naivety is not helping to solve the growing set of manufacturing and delivery problems, and the recovery process is likely to take longer than many think, all the while adding to the inflationary pressures.
Still, it’s clear from the chart above that there is a direct relationship between general prices (now being fueled by inflation) and the performance of CTAs, so we can expect this trend to continue until inflationary pressures ease up.
