There is a hypothesis that markets behave differently during U.S. Presidential Election years. In particular, managed futures strategies are said to perform better during the 4th Quarter of such years than others. We would like to thank Andrew Strasman of Totem Asset Group for a timely reminder about this effect.
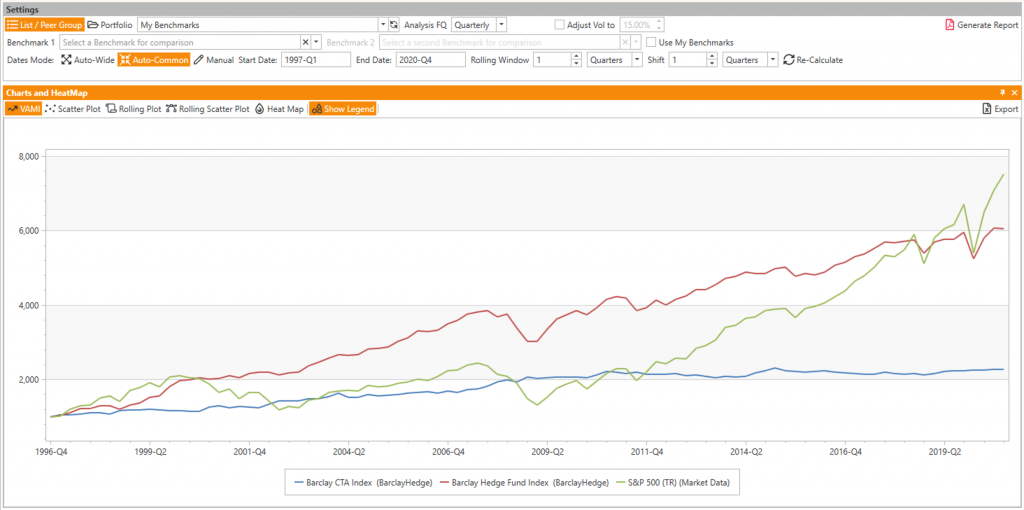
Empowered by AlphaBot’s ease of working with returns of different frequencies (e.g. converting monthlies and dailies to quarterly figures), we decided to take a closer look at this phenomenon. The task is quite straightforward – we use CTA and hedge fund indices from Barclay Hedge and equity indices (represented by the S&P 500), and calculate quarterly returns for the most common time frame, which is 1997 onwards:

We then identify the Election Years and calculate this simple table for Q4 return averages for all years, election years, and non-election years:

While this timeframe only covers 5 election years, the results are quite amazing. CTAs indeed perform better in Q4 of election years, by a wide margin of 3.7 percent. However, the results for hedge funds and equities are even more notable, but in the opposite direction: the former tend to perform worse by more than 4%, and the latter by more than 10.5% during the last quarter of election years vs non-election years.
Will this Q4 2020 follow the same pattern? It remains to be seen, of course, as we only have the monthly returns for October at the time of writing. In January the December data will be published and we will follow up on this topic. Stay tuned!