
We have reviewed performance of a 13-F based ETF, the Goldman Sachs Hedge Industry VIP ETF (GVIP) a couple times before, wondering if such a strategy can create a robust source of value added vs general equity market industry tracking. The results have been somewhat mixed depending on the timeframe: in our November 2021 analysis the ETF strongly outperformed the S&P 500, then in February 2022 we saw it fall back to match the index overall. And now in September 2022, it seems the hedge fund industry darlings have not been able to keep up; the GS ETF continues to underperform the general index, generating more losses through the end of August than the other stocks on average. To make the comparison more fair, we included the Russell 2000 index, as GVIP includes some smaller cap stocks.
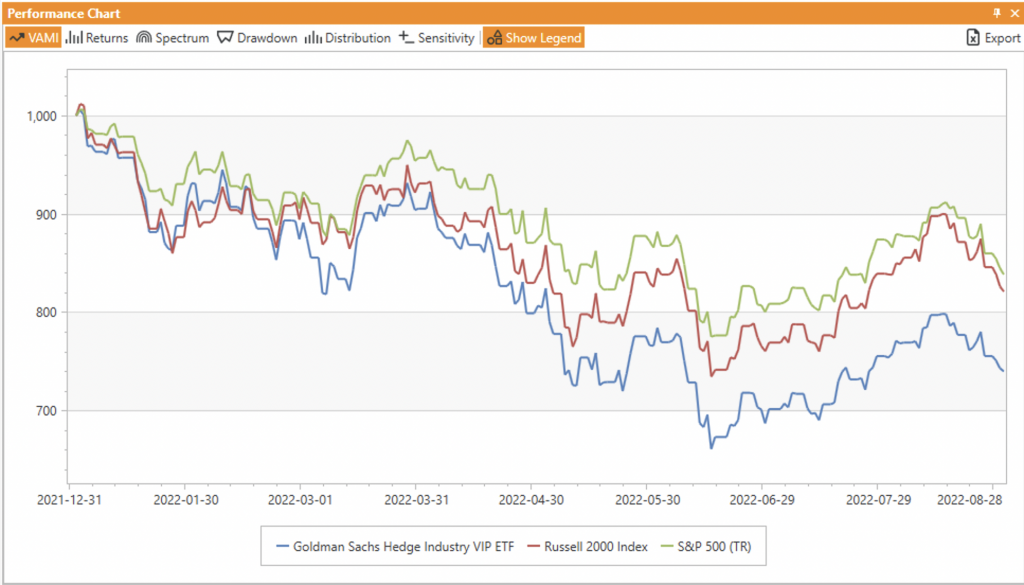
The exact YTD stats through the end of August show the ETF is behind both indices by almost 10%, with this figure pretty stable ever since the middle of June – the point of the worst drawdown for the markets this year.
If we look at a longer time horizon going back to 2016 (the inception year of the GVIP), we can see that the ETF has outperformed the Russell pretty consistently, and had gained a significant advantage over S&P for about 6 months in 2020 (and later gave it all up).
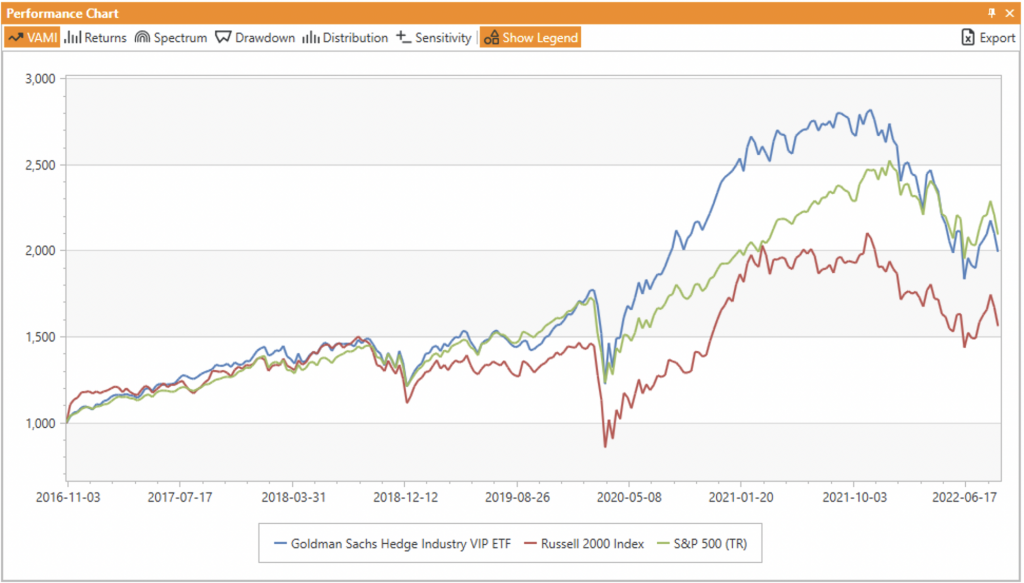
It is notable that most of the outperformance is stemming from the 2020 return, and without that exceptional year the ETF would really not have much to show for it.
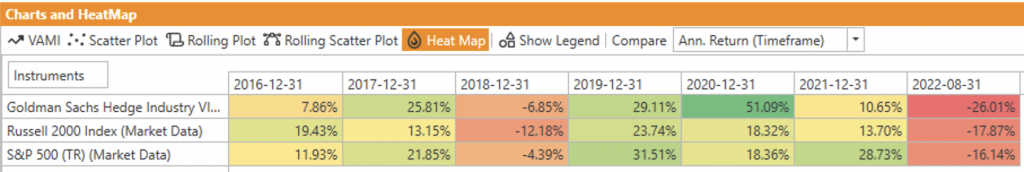
Such a performance pattern adds more weight to the passive investment argument – it is quite difficult to find (or create) an actively managed product that provides sustainable alpha and beats broad market indices consistently over an extended period of time. There is success here and there, from time to time, but with a long enough timeline, it seems to vanish and revert back to the average.
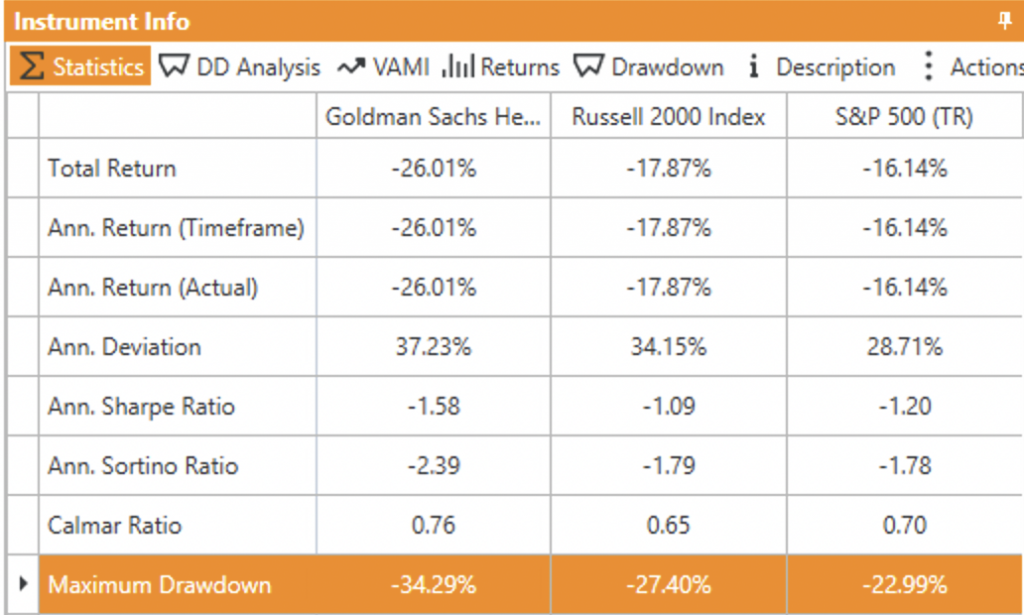
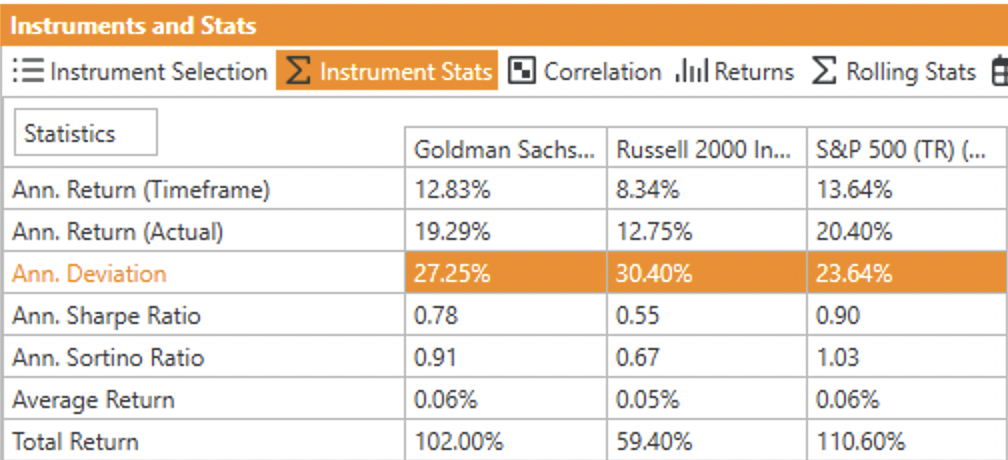
To conclude our quick review, here are the stats for the entire 2016-2022 period. The highlighted row shows the volatility of GVIP vs the benchmarks, and it is notable that it is right in the middle of the 3, and such are the risk adjusted stats as well.
Stay tuned with our blog for updates on GVIP and other market observations and thank you for reading!
